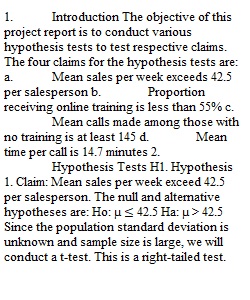


Q Your instructor will provide you with a data file that includes data on five variables: SALES represents the number of sales made this week. CALLS represents the number of sales calls made this week. TIME represents the average time per call this week. YEARS represents years of experience in the call center. TYPE represents the type of training the employee received. Part B: Hypothesis Testing and Confidence Intervals Complete the following four hypotheses, using ? = 0.05 for each. The week 5 spreadsheet can be used in these analyses. ? 1. Mean sales per week exceed 42.5 per salesperson ? 2. Proportion receiving online training is less than 55% ? 3 Mean calls made among those with no training is at least 145 ? 4. Mean time per call is 14.7 minutes • Using the same data set from part A, perform the hypothesis test for each speculation in order to see if there is evidence to support the manager's belief. Use the Eight Steps of a Test of Hypothesis from Section 9.1 of your text book as a guide. You can use either the p-value or the critical values to draw conclusions. Be sure to explain your conclusion and interpret that to the claim in simple terms • Compute 99% confidence intervals for the variables used in each hypothesis test, and interpret these intervals. • Write a report about the results, distilling down the results in a way that would be understandable to someone who does not know statistics. Clear explanations and interpretations are critical. • All DeVry University policies are in effect, including the plagiarism policy. • Project Part B report is due by the end of Week 6. • Project Part B is worth 100 total points. See grading rubric below. Format for report: A. Summary Report (about one paragraph on each of the four speculations) B. Appendix with the calculations of the Eight Elements of a Test of Hypothesis, the p-values, and the confidence intervals. Include the Excel formulas or spreadsheet screen shots used in the calculations. Part B: Grading Rubric Category Points % Description Addressing each speculation—20 points each 80 points 80% Hypothesis test, interpretation, confidence interval, and interpretation Summary report clarity 20 points 20% One paragraph on each of the speculations Total 100 points 100% A quality paper will meet or exceed all of the above requirements. Your instructor will provide you with a data file that includes data on five variables: SALES represents the number of sales made this week. CALLS represents the number of sales calls made this week. TIME represents the average time per call this week. YEARS represents years of experience in the call center. TYPE represents the type of training the employee received. Part B: Hypothesis Testing and Confidence Intervals Complete the following four hypotheses, using ? = 0.05 for each. The week 5 spreadsheet can be used in these analyses. ? 1. Mean sales per week exceed 42.5 per salesperson ? 2. Proportion receiving online training is less than 55% ? 3 Mean calls made among those with no training is at least 145 ? 4. Mean time per call is 14.7 minutes • Using the same data set from part A, perform the hypothesis test for each speculation in order to see if there is evidence to support the manager's belief. Use the Eight Steps of a Test of Hypothesis from Section 9.1 of your text book as a guide. You can use either the p-value or the critical values to draw conclusions. Be sure to explain your conclusion and interpret that to the claim in simple terms • Compute 99% confidence intervals for the variables used in each hypothesis test, and interpret these intervals. • Write a report about the results, distilling down the results in a way that would be understandable to someone who does not know statistics. Clear explanations and interpretations are critical. • All DeVry University policies are in effect, including the plagiarism policy. • Project Part B report is due by the end of Week 6. • Project Part B is worth 100 total points. See grading rubric below. Format for report: A. Summary Report (about one paragraph on each of the four speculations) B. Appendix with the calculations of the Eight Elements of a Test of Hypothesis, the p-values, and the confidence intervals. Include the Excel formulas or spreadsheet screen shots used in the calculations. Part B: Grading Rubric Category Points % Description Addressing each speculation—20 points each 80 points 80% Hypothesis test, interpretation, confidence interval, and interpretation Summary report clarity 20 points 20% One paragraph on each of the speculations Total 100 points 100% A quality paper will meet or exceed all of the above requirements.
View Related Questions